Why this data
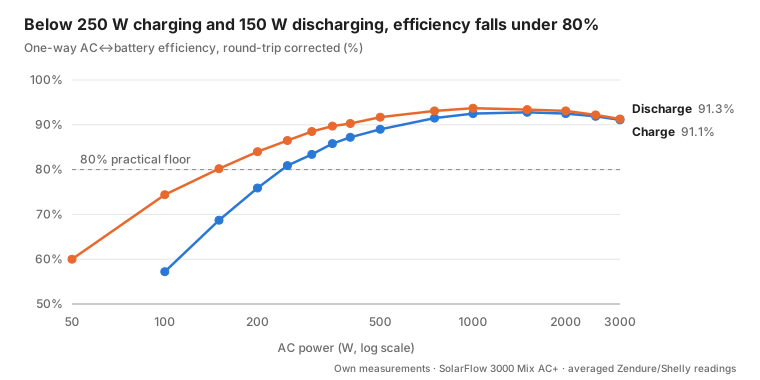
My Zendure SolarFlow 3000 Mix AC+ converts AC to battery and back at 93–94% at its best (1–2 kW), but below about 250 W of charging or 150 W of discharging it drops under 80%. Two full cycles measured from AC in to AC out returned 86.7% at 1.5 kW and 84.2% at 2.5 kW.
Zendure does not publish efficiency figures at this level of detail. Anyone who lets software decide when and how hard to charge needs the whole curve, because the cheapest kWh is worthless if a third of it is lost on the way in. This article publishes my measurements and shows how I use them in Home Assistant with the Zendure zenSDK package and the Day Ahead Optimizer (DAO).
Zendure does not publish efficiency figures at this level of detail. Anyone who lets software decide when and how hard to charge — a zero-on-the-meter automation, a price-driven scheduler — needs the whole curve, because the cheapest kWh is worthless if a third of it is lost on the way in. This article publishes my measurements and shows how I use them in Home Assistant with the Zendure zenSDK package and the Day Ahead Optimizer (DAO).
Setup and method
The battery is controlled locally from Home Assistant through the zenSDK package; DAO plans charge and discharge per 15-minute slot. For each fixed AC setpoint from 50 W to 3000 W I waited for steady state and logged two things:
- DC side: the battery pack power reported by the Zendure itself (into the pack when charging, out of it when discharging).
- AC side: the setpoint commanded to the Zendure, checked against an independent Shelly meter on the battery’s socket.
One-way efficiency is DC power over AC power when charging, and AC over DC when discharging. I calculated it once with the setpoint as AC reference and once with the Shelly reading, then averaged the two:
The two AC references agree within ±2% from about 500 W upwards. At low power they differ by 7–16 W, which is small in watts but large in percent (about 6 points at 100 W), hence the average.
Spot measurements miss losses the pack’s own power reading cannot see, so I also ran two complete cycles (full charge 10% to 100%, then full discharge 100% to 10%) at a constant 1500 W and 2500 W and counted AC energy in and out on both the Zendure and the Shelly. Round-trip efficiency (RTE) is AC energy out divided by AC energy in.
Efficiency versus power
Both directions peak between 1000 and 2000 W and fall off steeply at low power. At a 50 W charge setpoint nothing reached the battery at all: the Shelly saw 40 W go in and the pack reported 0 W.
The curve plotted above is the round-trip-corrected version explained further down. The table gives both the spot efficiencies and the corrected ones, each the average of the Zendure and Shelly readings.
| AC power (W) | Charge η, spot | Discharge η, spot | Charge η, corrected | Discharge η, corrected |
|---|---|---|---|---|
| 50 | 0.0% | 60.0% | 0.0% | 60.0% |
| 100 | 57.3% | 74.5% | 57.2% | 74.4% |
| 150 | 68.9% | 80.4% | 68.7% | 80.2% |
| 200 | 76.1% | 84.2% | 75.9% | 84.0% |
| 250 | 81.1% | 86.8% | 80.9% | 86.5% |
| 300 | 83.7% | 88.8% | 83.4% | 88.5% |
| 350 | 86.2% | 90.0% | 85.8% | 89.7% |
| 400 | 87.5% | 90.6% | 87.2% | 90.3% |
| 500 | 89.5% | 92.2% | 89.0% | 91.7% |
| 750 | 92.3% | 93.8% | 91.5% | 93.1% |
| 1000 | 93.4% | 94.7% | 92.5% | 93.7% |
| 1500 | 94.2% | 94.8% | 92.8% | 93.4% |
| 2000 | 94.3% | 95.0% | 92.5% | 93.1% |
| 2500 | 94.2% | 94.5% | 91.9% | 92.2% |
| 3000 | 93.9% | 94.1% | 91.1% | 91.3% |
Where the losses go
The shape of the curve comes from a fixed overhead of roughly 44 W while charging and 27 W while discharging, plus a part that grows with the square of the power. A quadratic fit to the measured loss (AC minus DC when charging, DC minus AC when discharging, 100–3000 W) stays within 2–4 W of every point:
Why a quadratic: it is the standard loss model for power electronics. At a roughly constant battery and grid voltage, current is proportional to power, and the losses split into three kinds. The constant term covers control electronics, gate drivers and magnetising losses, present whenever the inverter runs. The linear term covers voltage drops over diodes and switching losses, which scale with current. The quadratic term covers resistive I²R losses in MOSFETs, inductors, cabling and cells. The fit leaves out the 50 W point, where nothing reached the pack while charging. It only serves to explain the curve and is not used anywhere else: the efficiencies, the round-trip correction and the DAO stages all come straight from the measurements.
That fixed part is what kills low-power operation: at 100 W charging, 43 W of it is lost, while at 1500 W the loss is 87 W, or under 6%. Above about 2 kW the quadratic term takes over and efficiency slowly drops again. The fixed overhead is higher when charging than discharging, which is why the charge curve crosses 80% at a higher power.
Round-trip efficiency
A full cycle loses more than the spot measurements predict: 2.6% more at 1.5 kW and 4.9% more at 2.5 kW. Energy values are the average of the Zendure and Shelly counters.
| Power | AC in (kWh) | AC out (kWh) | RTE measured | RTE from spot values | Delta |
|---|---|---|---|---|---|
| 1500 W | 8.23 | 7.13 | 86.7% | 89.3% | −2.6% |
| 2500 W | 8.32 | 7.00 | 84.2% | 89.0% | −4.9% |
The gap grows with power, which points at losses the pack’s own power reading does not see, such as resistance inside the cells. I modelled it as proportional to power, fitted through zero on the two cycles: about −1.9 points of RTE per kW (k = −1.88 × 10⁻⁵ per W).
A linear gap is also what the loss model above predicts for the pack. Resistive losses in the cells grow with the square of power, so as a fraction of the power they grow linearly, and the RTE gap with them. It has one parameter, so two cycles fit it and still leave one degree of freedom to check it.
To get one-way curves that add up to the measured RTE, I split that gap evenly over charging and discharging:
Multiplied together, the corrected curves give 86.6% at 1.5 kW and 84.7% at 2.5 kW, within half a point of the measured cycles. These corrected values are the ones in the chart and table above. They also agree on usable storage: 8.2 kWh in at 92.8% and 7.1 kWh out at 93.4% both point to about 7.6 kWh actually held in the pack over the cycled range.
Practical tips
Keep charging above about 250 W and discharging above about 150 W, and do the bulk of the work between 750 and 2000 W. The reasoning, and when to break the rule:
Don’t let grid-following charging trickle. In a zero-on-the-meter mode the battery follows whatever solar surplus is left, which on a cloudy day or in the evening is often 50–200 W. Charged at 150 W, only 68.7% reaches the pack; discharged later at 1 kW, just 64% of the original energy comes back. In the zenSDK package, set start charging at to around −300 W so charging only begins when there is a real surplus, and make sure it stops again once the surplus falls below roughly 250 W instead of following it down.
Set a discharge floor too. Covering a 100 W night-time base load from the battery runs at 74% one-way; combined with a 1.5 kW charge that is 69% round trip. Start discharging at around 150 W keeps the worst of this out. Whether the remaining low-load hours are worth covering depends on the price spread, which is exactly what a planner like DAO can weigh.
The break-even is a price question, not a fixed number. Storing energy pays when the value you give up now is lower than what it saves later, after both conversions:
With a decent export price, trickle charging at 57–69% is a loss. With a zero or negative export price, even a poor conversion beats giving the energy away, so the floor can come down in those hours.
Don’t run at 3 kW by default. Efficiency peaks at 1–1.5 kW. A cycle at 2.5 kW returned 2.5 points less than one at 1.5 kW, and the corrected curves put a 3 kW cycle near 83%. Full power earns its keep only when a short price spike is worth more than the extra loss.
Put the inverter in standby when idle. The zenSDK package documents about 19 W of idle draw when the inverter is not put into full standby, around 0.45 kWh a day. Its standby delay setting (15 minutes recommended) handles this.
Configuring Day Ahead Optimizer
In DAO the corrected curves go straight into the charge and discharge stages, and the two DC efficiencies are set to 1. The stage power is the AC-side power; DAO turns each stage into a point (AC power, AC power × efficiency) and interpolates linearly between them.
"charge stages": [
  {"power": 250,  "efficiency": 0.809},
  {"power": 500,  "efficiency": 0.890},
  {"power": 750,  "efficiency": 0.915},
  {"power": 1000, "efficiency": 0.925},
  {"power": 1500, "efficiency": 0.928},
  {"power": 2000, "efficiency": 0.925},
  {"power": 2500, "efficiency": 0.919},
  {"power": 3000, "efficiency": 0.911}
],
"discharge stages": [
  {"power": 250,  "efficiency": 0.865},
  {"power": 500,  "efficiency": 0.917},
  {"power": 750,  "efficiency": 0.931},
  {"power": 1000, "efficiency": 0.937},
  {"power": 1500, "efficiency": 0.934},
  {"power": 2000, "efficiency": 0.931},
  {"power": 2500, "efficiency": 0.922},
  {"power": 3000, "efficiency": 0.913}
],
"minimum power": 250,
"dc_to_bat efficiency": 1.0,
"bat_to_dc efficiency": 1.0Why the DC efficiencies are 1. DAO’s state-of-charge equation multiplies every flow into the pack by dc_to_bat efficiency and divides every flow out by bat_to_dc efficiency, AC-coupled flows included. My stage values already contain all losses up to the measured round trip, so anything below 1 would count the battery losses twice.
Why the stages start at 250 W. When DAO plans a slot below minimum power and an entity stop inverter is configured, it runs the battery at the minimum power and stops the inverter part-way through the slot. The energy is the same, but it moves at the more efficient power: a planned 100 W quarter becomes 250 W for 6 minutes, then off. DAO models the stretch between 0 W and the first stage as a straight line, so it assumes the first stage’s efficiency for any smaller plan — which is exactly right if the first stage equals minimum power. Leave the lower stages out and set minimum power to that first stage. A handful of stages is enough; each one adds variables to the optimisation, which counts at 15-minute resolution.
DAO and the zenSDK thresholds are separate. The zenSDK package’s minimum charge and discharge thresholds only act while the battery runs in its own grid-following mode. DAO’s minimum power acts on the setpoints DAO sends, and it is one value for both directions. Set it to the charge floor (250 W), not to the lower discharge floor: discharging also runs better in 250 W bursts than continuously at 150 W, 86.5% against 80.2%.
Capacity. Because the stages include the pack-side losses, capacity and the SoC limits should describe the energy actually held in the pack, about 7.6 kWh over the range I cycled.
My two cycles ran from 10% to 100% SoC, so with lower limit 10 and upper limit 100 the matching capacity is 7.6 / 0.9 ≈ 8.5 kWh. That is an effective figure for DAO’s bookkeeping, not the nameplate capacity.
For planning, these are the 15-minute slots a full charge or discharge took at constant power:
| Power | Slots to charge | Slots to discharge |
|---|---|---|
| 1500 W | 23 | 21 |
| 2000 W | 17 | 15 |
| 2500 W | 14 | 12 |
| 3000 W | 11 | 10 |
Limitations and next measurements
The round-trip correction rests on two cycles, so treat it as a first estimate.
- One unit, steady-state points, no record of cell temperature or of how efficiency changes near empty or full.
- Idle and standby consumption are not in these numbers.
- The Shelly and the Zendure disagree by up to 2% at high power; the average of both is used throughout.
- Next: full cycles at 500 W and 3000 W, to pin down the low of the correction and to confirm the quadratic term at maximum power.
Sources
- Gielz1986/Zendure-HA-zenSDK — Home Assistant package for local zenSDK control, including the charge/discharge thresholds and standby delay mentioned above.
- corneel27/day-ahead and its SETTINGS.md — battery stage, minimum power and DC efficiency settings.
- Raw data: my own spreadsheet of the measurements above.